Loss of ice from Antarctica and Greenland’s shrinking ice sheet is responsible for 0.55 inches (14 millimeters) of sea level rise since 2003, according to a new study.
Using the most advanced Earth-observing laser instrument NASA has ever flown in space, researchers made precise measurements of how the Greenland and Antarctic ice sheets have changed over 16 years.
As reported in Science, the loss of the floating ice shelves melting in a warming ocean drives sea level rise in Antarctica. These ice shelves help hold back the flow of land-based ice.
“If you watch a glacier or ice sheet for a month, or a year, you’re not going to learn much about what the climate is doing to it.”
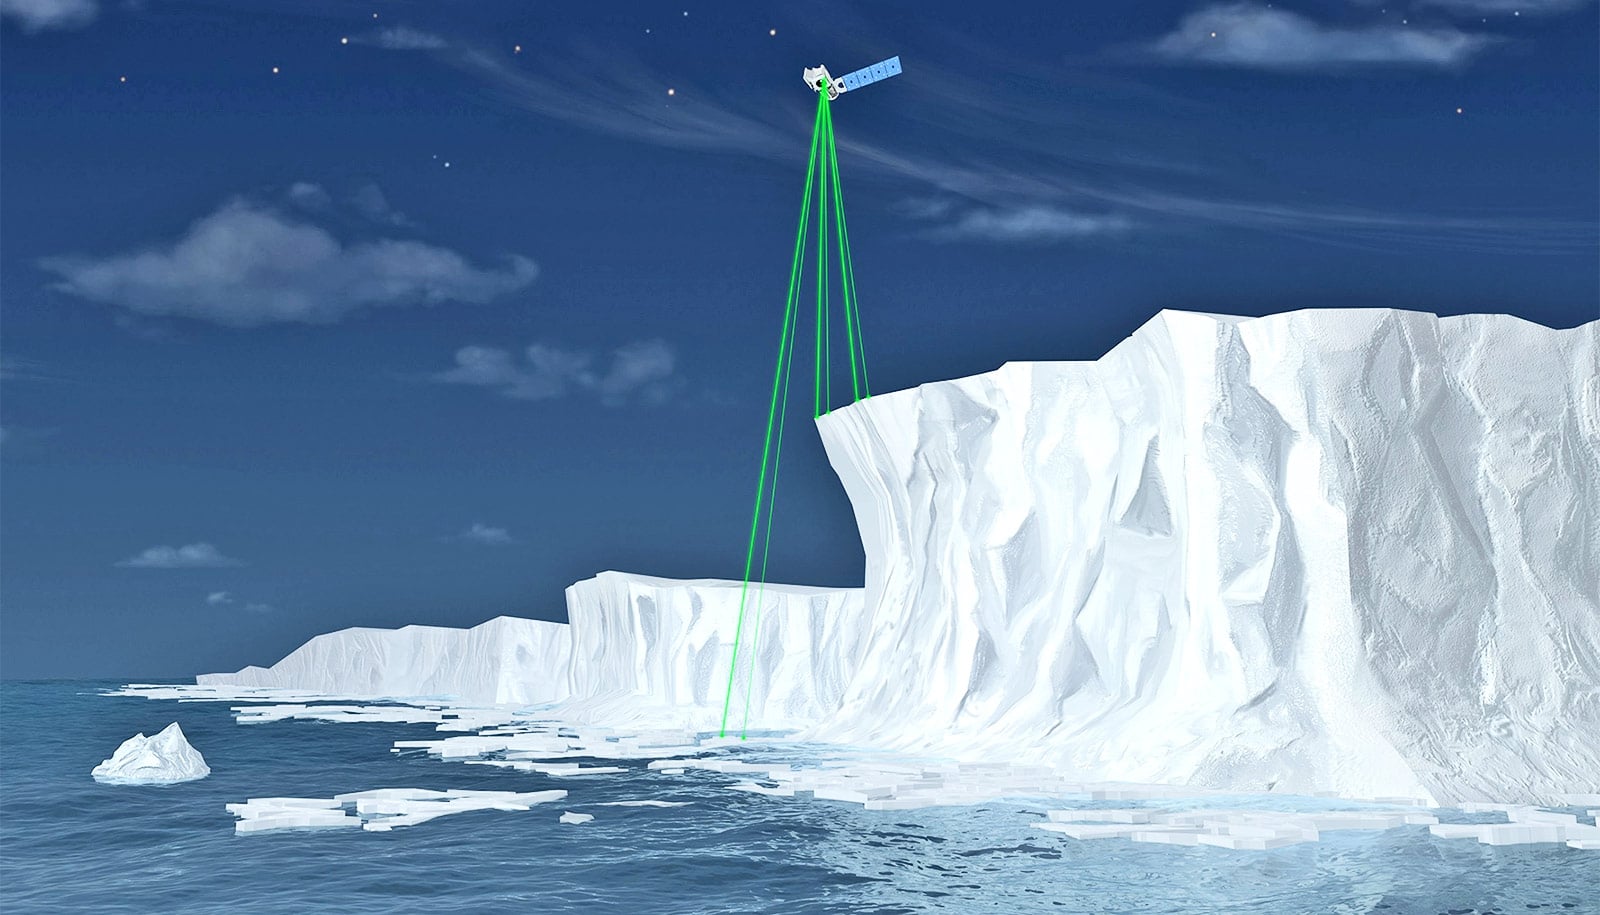
The findings come from the Ice, Cloud, and land Elevation Satellite 2 (ICESat-2), which launched into orbit in fall 2018 and began taking detailed global elevation measurements, including over Earth’s frozen regions.
Comparing the new data with measurements the original ICESat took from 2003 to 2009 allowed researchers to generate a comprehensive portrait of the complexities of ice sheet change—and insights into the future of Greenland and Antarctica.

“If you watch a glacier or ice sheet for a month, or a year, you’re not going to learn much about what the climate is doing to it,” says lead author Benjamin Smith, a glaciologist at the University of Washington Applied Physics Laboratory.
“We now have a 16-year span between ICESat and ICESat-2 and can be much more confident that the changes we’re seeing in the ice have to do with the long-term changes in the climate. And ICESat-2 is a really remarkable tool for making these measurements. We’re seeing high-quality measurements that carpet both ice sheets, which let us make a detailed and precise comparison with the ICESat data.”
Thinning glaciers
Previous studies of ice loss or gain often analyze data from multiple satellites and airborne missions. The new study takes a single type of measurement—height as measured by an instrument that bounces laser pulses off the ice surface—providing the most detailed and accurate picture of ice sheet change to date.
The researchers took tracks of ICESat measurements and overlaid the denser tracks of ICESat-2 measurements from 2019. Where the two data sets intersected—tens of millions of sites—the researchers ran the data through computer programs that accounted for the snow density and other factors, and then calculated the mass of ice lost or gained.
“The new analysis reveals the ice sheets’ response to changes in climate with unprecedented detail, revealing clues as to why and how the ice sheets are reacting the way they are,” says coauthor Alex Gardner, a glaciologist at NASA’s Jet Propulsion Laboratory in Pasadena, California.

The study shows that Greenland’s ice sheet lost an average of 200 gigatons of ice per year, and Antarctica’s ice sheet lost an average of 118 gigatons of ice per year. One gigaton of ice is enough to fill 400,000 Olympic-sized swimming pools.
Of the sea level rise that resulted from ice sheet meltwater and iceberg calving, about two-thirds of it came Greenland, the other third from Antarctica, Smith says.
“It was amazing to see how good the ICESat-2 data looked, right out of the gate,” says coauthor Tom Neumann from NASA’s Goddard Space Flight Center in Greenbelt, Maryland. “These first results looking at land ice confirm the consensus from other research groups, but they also let us look at the details of change in individual glaciers and ice shelves at the same time.”
In Greenland, there was a significant amount of thinning of coastal glaciers, Smith says. The Kangerlussuaq and Jakobshavn glaciers, for example, have lost 14 to 20 feet (4 to 6 meters) of elevation per year. Warmer summer temperatures have melted ice from the surface of the glaciers and ice sheets, and in some places warmer ocean water erodes away the ice at their fronts.
In Antarctica, the dense tracks of ICESat-2 measurements showed that the ice sheet is getting thicker in parts of the continent’s interior, likely as a result of increased snowfall, Smith says.
The loss of ice from the continent’s margins, especially in West Antarctica and the Antarctic Peninsula, however, far outweighs any gains in the interior. In those places, the ocean is also likely to blame.
“In West Antarctica, we’re seeing a lot of glaciers thinning very rapidly,” Smith says. “There are ice shelves at the downstream end of those glaciers, floating on water. And those ice shelves are thinning, letting more ice flow out into the ocean as the warmer water erodes the ice.”
These ice shelves, which rise and fall with the tides, can be difficult to measure, says coauthor Helen Amanda Fricker, a glaciologist at Scripps Institution of Oceanography at the University of California, San Diego. Some of them have rough surfaces, with crevasses and ridges, but the precision and high resolution of ICESat-2 allows researchers to measure overall changes, without worrying about these features skewing the results.
Stability from ice sheets
This is one of the first times that researchers have measured loss of the floating ice shelves around Antarctica simultaneously with loss of the continent’s ice sheet.
Ice that melts from ice shelves doesn’t raise sea levels, since it’s already floating—just like an ice cube melting in a full cup of water doesn’t overflow the glass. But the ice shelves do provide stability for the glaciers and ice sheets behind them.
“It’s like an architectural buttress that holds up a cathedral,” Fricker says. “The ice shelves hold the ice sheet up. If you take away the ice shelves, or even if you thin them, you’re reducing that buttressing force, so the grounded ice can flow faster.”
The researchers found ice shelves in West Antarctica, the location of many of the continent’s fastest-moving glaciers, are losing mass. Patterns of thinning show that Thwaites and Crosson ice shelves have thinned the most, an average of about 5 meters (16 feet) and 3 meters (10 feet) of ice per year, respectively.
NASA funded the study. Additional coauthors are from NASA; Amherst College; the University of California, San Diego; the University of Maryland; the University at Buffalo; the Colorado School of Mines; and the University of Washington.
Source: University of Washington