Despite the presence of vaccines, excess deaths in year two of the COVID-19 pandemic actually increased in rural areas, according to a new study.
Presumably, vaccines created specifically to fight a new and deadly disease should have caused a dramatic reduction in deaths from that disease. And, according to the new research, they did—but only in large, metropolitan counties. In rural counties across the United States, vaccines were harder to obtain, vaccine skepticism remained higher, and access to good health care is often more challenging.
The study provides the first look at monthly estimates of what the researchers call “excess deaths” for every US county in the pandemic’s first two years. It says an estimated 1,179,024 excess deaths occurred during those first two years (first: 634,830; second: 544,194), a figure found by comparing mortality rates across all US counties for those years versus the years 2015–2019.
“We define excess mortality as the difference between what was observed versus what we would have expected,” says Andrew Stokes, an assistant professor of global health at Boston University School of Public Health and corresponding author of the study.
Below, Stokes talks about the new study, which appears in the journal Science Advances. Among his other studies into COVID was one looking at “hidden deaths” from the disease—where he found the actual pandemic death toll could be 20% higher than the formal count.
This research had support from the Robert Wood Johnson Foundation, the National Institute on Aging, the W. K. Kellogg Foundation, the Boston University Center for Emerging Infectious Diseases Policy & Research, and the National Science Foundation.
(This interview has been edited for clarity; additional detail was also added after initial publication on The Brink.)
There have been so many studies examining death rates due to COVID. Can you talk about your interest and approach for this novel study?
Many studies have estimated the impact of COVID-19 during the first year, 2020, but as the pandemic evolved, there was less information on the coming waves and the ways they affected different regions and communities. We thought comparing data from the first year to the second year would provide insight into the evolving impact of the pandemic and how mortality rates changed across the country. This was especially valuable to do using an excess mortality metric, as official COVID-19 death surveillance likely worsened over time as testing became increasingly limited in many communities.
Right. Because the second year is when vaccines were ready, so states had to figure out how they were going to make them readily available to people.
Vaccines became available right at the end of the first year, the end of 2020. This next pandemic year, which stretches from 2021 to 2022, was an important year to understand patterns of mortality. It turns out that association with vaccines and mortality was very strong.
What jumped out at you through the data?
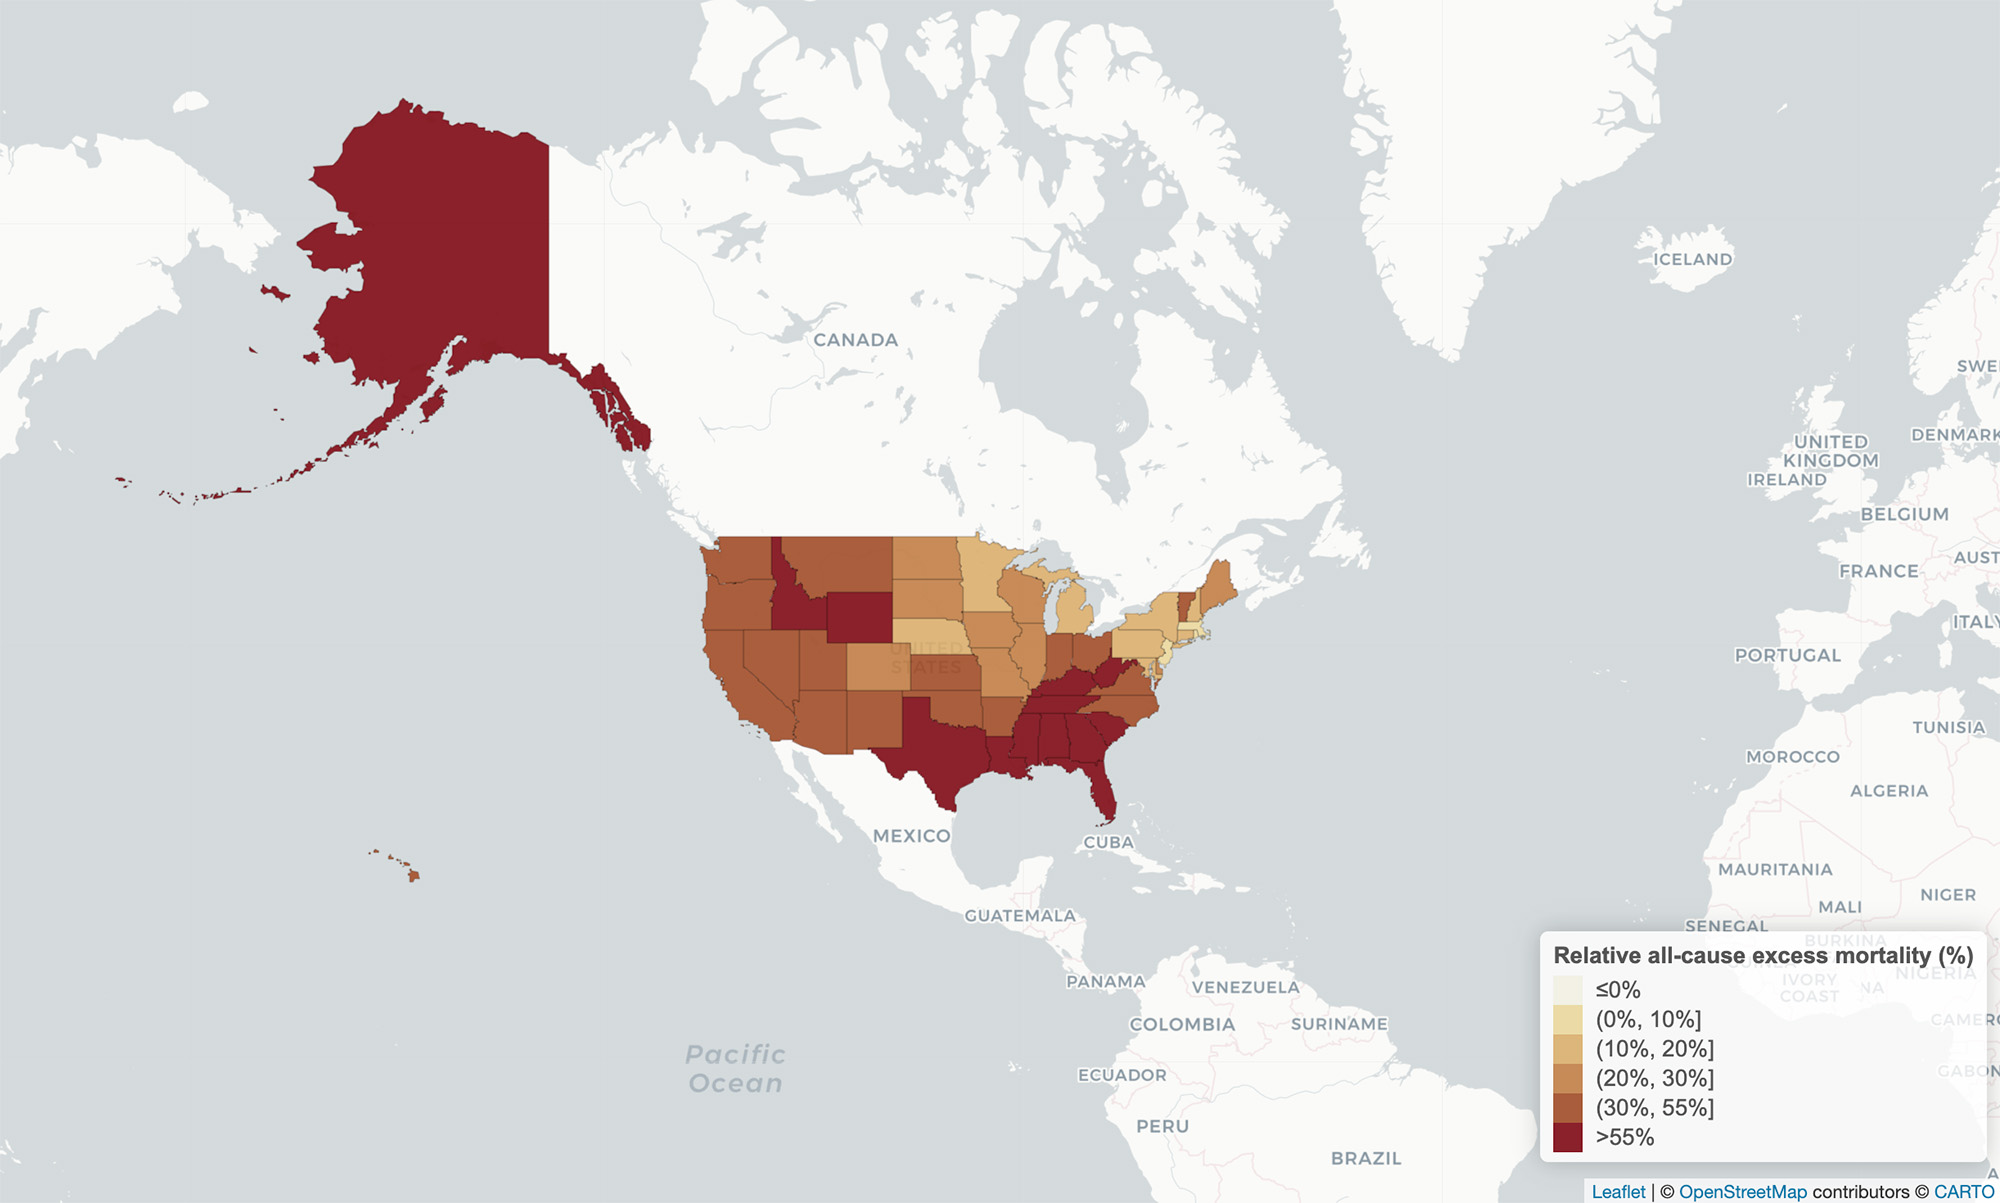
One major finding of the study, monitoring at the county level, is that yes, there was inequity across rural and urban lines, across the urban-rural continuum. While the pandemic slowed down after the first year in large metropolitan areas, rural areas continued to experience a significant burden of excess deaths throughout the second year of the pandemic.
Inequalities in mortality outcomes in the second year of the pandemic were fundamentally shaped by patterns of vaccine uptake at the community level. We observed increasingly divergent outcomes across states and across the urban-rural continuum as gaps in vaccine uptake widened.
So, what conclusions do you draw from that?
It’s a combination of factors. There was less vaccination happening in rural areas and that gap between urban and rural areas grew as the second year progressed. There was momentum for vaccine access in urban areas, with vaccine distribution clinics and mass vaccination sites. But those things were not widely implemented in rural America. Then there are the long-standing gaps in rural health care related to funding gaps and workforce shortages, making it much harder to be cared for and to get high-quality care. There was also a lack of COVID-19 testing.
So, the pandemic really hit rural America in the second year, when vaccines were available, harder than it hit urban areas.
Rural America was being affected disproportionately and had fewer safeguards to combat the whole of COVID-19. This was especially pronounced among blue-collar workers who suffered economic losses when they had to stay home but could not work from home. The economic consequences those communities suffered shaped their responses to COVID-19 policies. The emergence of partisanship and misinformation further disadvantaged small metropolitan and rural areas during the second year of the pandemic. This partisanship even went as far as deteriorating the quality of surveillance data by affecting the certification of COVID-19 deaths, which were systematically undercounted in rural communities.
Can you talk more specifically about how different states responded to COVID and its impact on them?
The high excess death rates that burdened large cities in the Northeast and Mid-Atlantic regions in the first months of the pandemic began to shift to more rural areas in the South and West as early as August 2020, with the sharpest increases occurring during the wave of the highly contagious Delta variant in the spring and summer of 2021. In our maps, you see that these later waves of Delta and Omicron, when widespread vaccination was largely available, were much more pronounced in southern states and rural counties. If you compare Massachusetts to Tennessee, Massachusetts had very little impact from Delta, where Tennessee had a profound Delta surge. In Massachusetts, a large fraction of the population was vaccinated. But southern states like Tennessee or Mississippi, with lower vaccination rates, with many rural counties, really suffered during that second wave.
What about Florida? Republican Governor Ron DeSantis has proudly proclaimed that Florida did not shut down because of COVID and was better for it. Is he right?
What happened in Florida is quite heterogeneous. Highly affluent areas in south Florida, Democratic-leaning counties in certain parts that were highly vaccinated, did well. But rural Florida looks more like the rest of the South. It had very high excess mortality during Delta, and those were largely preventable deaths. And it occurred at a time when Florida had very few mitigation measures in place to protect their rural residents.
OK, then take a different big state: California.
Even states like California, with its more progressive public health policies, were not completely insulated from the widening chasm between rural and urban areas that became increasingly stark over the second year of the pandemic. This highlights the limits of states’ policy responses in reaching rural America. Even as large metro areas in those same states experienced declines in COVID-19-related mortality as the pandemic progressed, rural counties were heavily burdened with deaths from COVID-19.
Taking the data from a 30,000-foot view, what do you see?
The really striking finding is that despite the strong efficacy of vaccines and high uptake in many large metropolitan areas, the number of excess deaths in the second year was not substantially lower than in the first year. The many deaths in rural, nonmetropolitan areas likely contributed to the high excess mortality we saw in the second year. Many of the deaths in the second year were preventable, through wider vaccination.
For the vaccine skeptics out there—and we know there are many of them—what does your study say to them?
This study simply compares what happened to what should have happened. It’s hard to argue with excess mortality.
Source: Boston University