Researchers have charted the distribution of phytoplankton in the world’s oceans for the first time and investigated the environmental factors that explain it.
They conclude that plankton diversity is only partially congruent with previous theories of biodiversity for the seas between the equator and the poles.
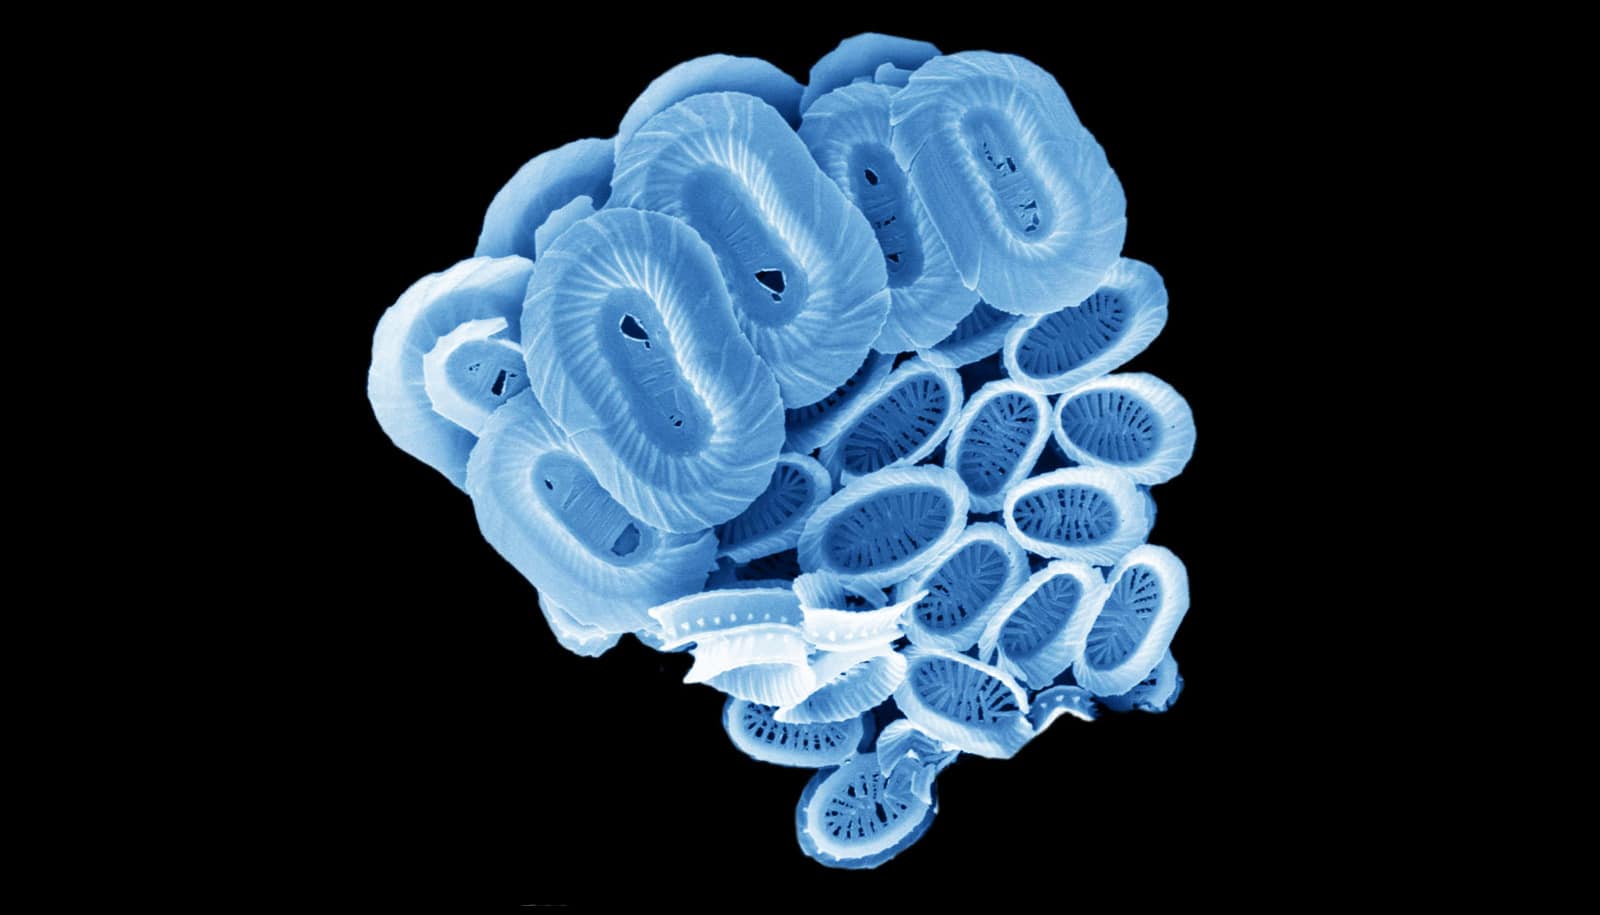
With some 10,000 to 20,000 different species in the world’s oceans, the diversity of phytoplankton (“phyto” from the Greek for plant) species is extremely rich. These phytoplankton form a key element of ocean ecosystems and life on this planet, producing more oxygen than all the world’s rainforests combined. They also serve as the fundamental basis of the marine food chain.
Although researchers have identified many species of phytoplankton, the question of when and where they occur is largely unexplored; in light of the current biodiversity crisis, this represents a serious knowledge gap.
Now, in Science Advances, a team of researchers models the spatial and temporal distribution of over 530 different species of phytoplankton. As the basis for their distribution charts, they used around 700,000 water samples from across the world’s oceans.
Surprising locations
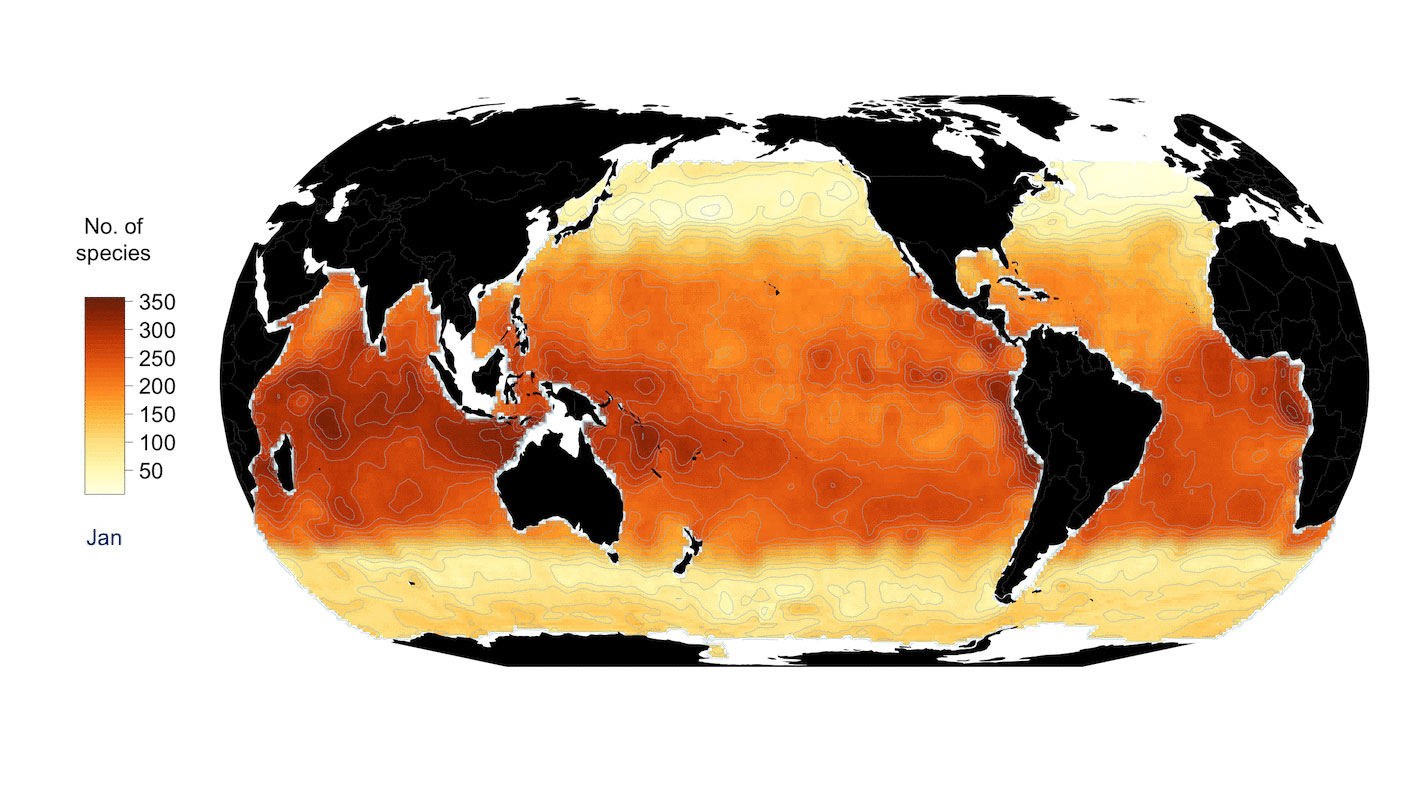
The work reveals that tropical waters hold the richest diversity of species at all times of the year. Phytoplankton diversity is particularly high in the seas of the Indonesian-Australian archipelago, in parts of the Indian Ocean, and in the equatorial Pacific Ocean. In the subtropics, biodiversity drops off markedly beyond 30 degrees latitude North and South, reaching its lowest values around a latitude of 55 degrees. Diversity then picks up again slightly towards the poles.
“We were surprised to find that on a monthly basis, the polar seas present greater diversity than the mid-latitudes,” says Damiano Righetti, the lead author of the study. He is a PhD student with ETH Zurich professor Nicolas Gruber and senior scientist Meike Vogt. “It’s remarkable because global species distribution and diversity are normally closely linked to environmental temperature trends.”
Species diversity typically decreases continuously towards the poles, where it is normally lowest. Temperature could plausibly be the direct driver of this decline. According to metabolic theory, higher temperatures accelerate metabolism, mutations of genetic material, and speciation. This explains why the tropics are richer in species than the mid-latitudes and the polar regions.
The study reveals that phytoplankton do not always behave in line with this theory. “Evidently, there are factors other than temperature affecting plankton diversity,” Righetti says. Two of these might be the strong currents and turbulence, which are prevalent in the mid-latitudes, but less so in polar or tropical seas. “The seasonal fluctuations and ocean turbulence in these latitudes might suppress the development of biodiversity, even though the temperatures here are higher than in the polar oceans,” he says.
Righetti and colleagues also found that phytoplankton diversity in the mid-latitudes, unlike in the tropics, varies greatly from season to season. Righetti explains that although the number of species in the mid-latitudes is constant over time, the species composition changes over the course of the year: “In contrast to tropical seas, the diversity here is dynamic throughout the year, but hardly any research has been done on this.”
Research cruises
Working with ETH adjunct professor Niklaus Zimmermann and colleagues from the Swiss Federal Institute for Forest, Snow, and Landscape Research WSL, Righetti developed a computer model to map the diversity distribution of phytoplankton. They fed this model with observational data and used it to project where each species occurs with a temporal resolution of one month.
The observational data came from water samples collected during research trips as well as from normal shipping routes. Phytoplankton specialists subsequently studied the samples under the microscope to determine which species they contained. Over time, the research cruises amassed huge amounts of observational data on several thousand different species. Righetti and colleagues then gathered the available data into a database and analyzed it.
It must be noted, however, that sampling has not been evenly distributed across the oceans and, in many regions, has not spanned all seasons. Thanks to British researchers, the North Atlantic is very well represented, but very little data exist for large parts of the other oceans. The researchers compensated for this distortion in their models.
The distribution maps are the first to chart phytoplankton and their models can also help predict how the diversity of phytoplankton could develop under changing temperature conditions. Warmer waters as a result of climate change could alter the distribution of phytoplankton. “In turn, this could have a serious impact on the entire marine food chain,” Righetti says.
Source: ETH Zurich