
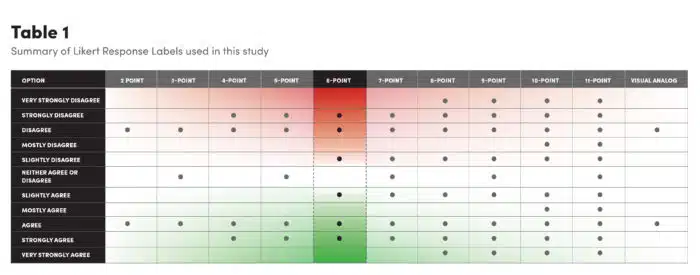
The Likert Scale—the measurement tool that asks, “Do you strongly disagree, disagree, neither agree nor disagree, agree, or strongly agree?”—warrants some testing of its own.
You’ve probably seen Likert Scales even if you don’t know them by name. They show up in psychological contexts and other social science research, business, employment interviews, political polling, education, and often at the close of an online retail purchase or help desk exchange. They’re everywhere, and profoundly elastic, sometimes presenting respondents with as many as 11 defined options or in some applications, infinite choices realized through the use of a click-and-drag slider along a continuum.
Despite the theme and variation approach to implementation, no one—before a recent study—had optimally tested the test, often extending and elaborating the scale with little empirical justification regarding the number of response options. There’s no conclusive evidence that even Rensis Likert, the social psychologist who developed his namesake scale in 1932, did any kind of testing before using it in his doctoral dissertation.
“On a 9-point scale the difference between ‘strongly agree’ and ‘very strongly agree’ goes beyond our cognitive capacity.”
“The number of options does matter, especially for measures of personality constructs like those we assessed in our study,” says Leonard Simms, an associate professor in the University at Buffalo psychology department and lead author of the new study in the journal Psychological Assessment.
“We spend a lot of time thinking about what we should ask in our research, but we almost never collect data on the response options,” says Simms. “We’ve been basing a lot of this on lore, but these decisions can’t be taken for granted.
“If you’re going to deviate from what this paper suggests then that decision should first be tested.”
What does 3 out of 5 really mean?
What does the paper suggest? Consider this example: “‘I’m pleased with the reliability of my internet service provider (ISP).’ Do you strongly disagree, disagree, neither agree nor disagree, agree, or strongly agree?” Would doubling the number of response options improve accuracy? What about providing fewer options?
“Six appears to be the magic number,” says Simms. “There is nothing perfect about six, but I’m doubtful that there would be evidence that responses beyond six would be that helpful.”
Part of the utility in six responses rather than five, or more generally, an even number of options rather than an odd number, is the elimination of a middle choice that often sits like an island of apathy, giving respondents an unintentional respite that provides researchers with little useful data.
On a five-point scale, presumably “three” should mean something greater than “two” and less than “four.” But Simms says some respondents use the middle number for reasons not relevant to the trait that’s being measured.
“My perspective going into to this was that an even number is better than an odd number and the data from our research does seem to back that up,” says Simms, an expert in applied and basic psychological assessment. “Respondents often don’t know what to say or they’re not sure how they feel or they don’t care to say how they feel or they might be lazy. To be done with it, they pick the middle number.
“This adds noise, not signal, to the research.”
More precision isn’t always better
Some questionnaires use a visual analog that requires moving a slider along a continuum rather than selecting a numbered response, but Simms says people don’t actually think in such granular terms.
“There’s a limit to what humans can distinguish along these constructs that we’re trying to measure,” he says. “Having a precise scale does not mean people can make precise estimates.”
The same shortcoming is present with scales that climb beyond six options.
“On a nine-point scale the difference between ‘strongly agree’ and ‘very strongly agree’ goes beyond our cognitive capacity,” says Simms. “Just like the slider, there’s an appearance of precision, but the distinctions people make are not that precise.”
Simms and his research team recruited more than 1,300 participants divided into groups that tested an even- and odd-numbered response option in pairs that moved progressively in groups of two tests beginning with the two- and three-response group. A sixth group tested the visual analog scale twice. Each participant completed the Big Five Inventory, a 44-item scale that provides scores on the domains of neuroticism, extraversion, conscientiousness, agreeableness, and openness.
“We see through this study that measures and the reliability of the measures are impacted by these response options and features,” says Simms. “It’s important.”
Source: University at Buffalo