An expert has answers for you about how data science, computer vision, and wearable tech are changing how athletes train and fans watch the Olympics.
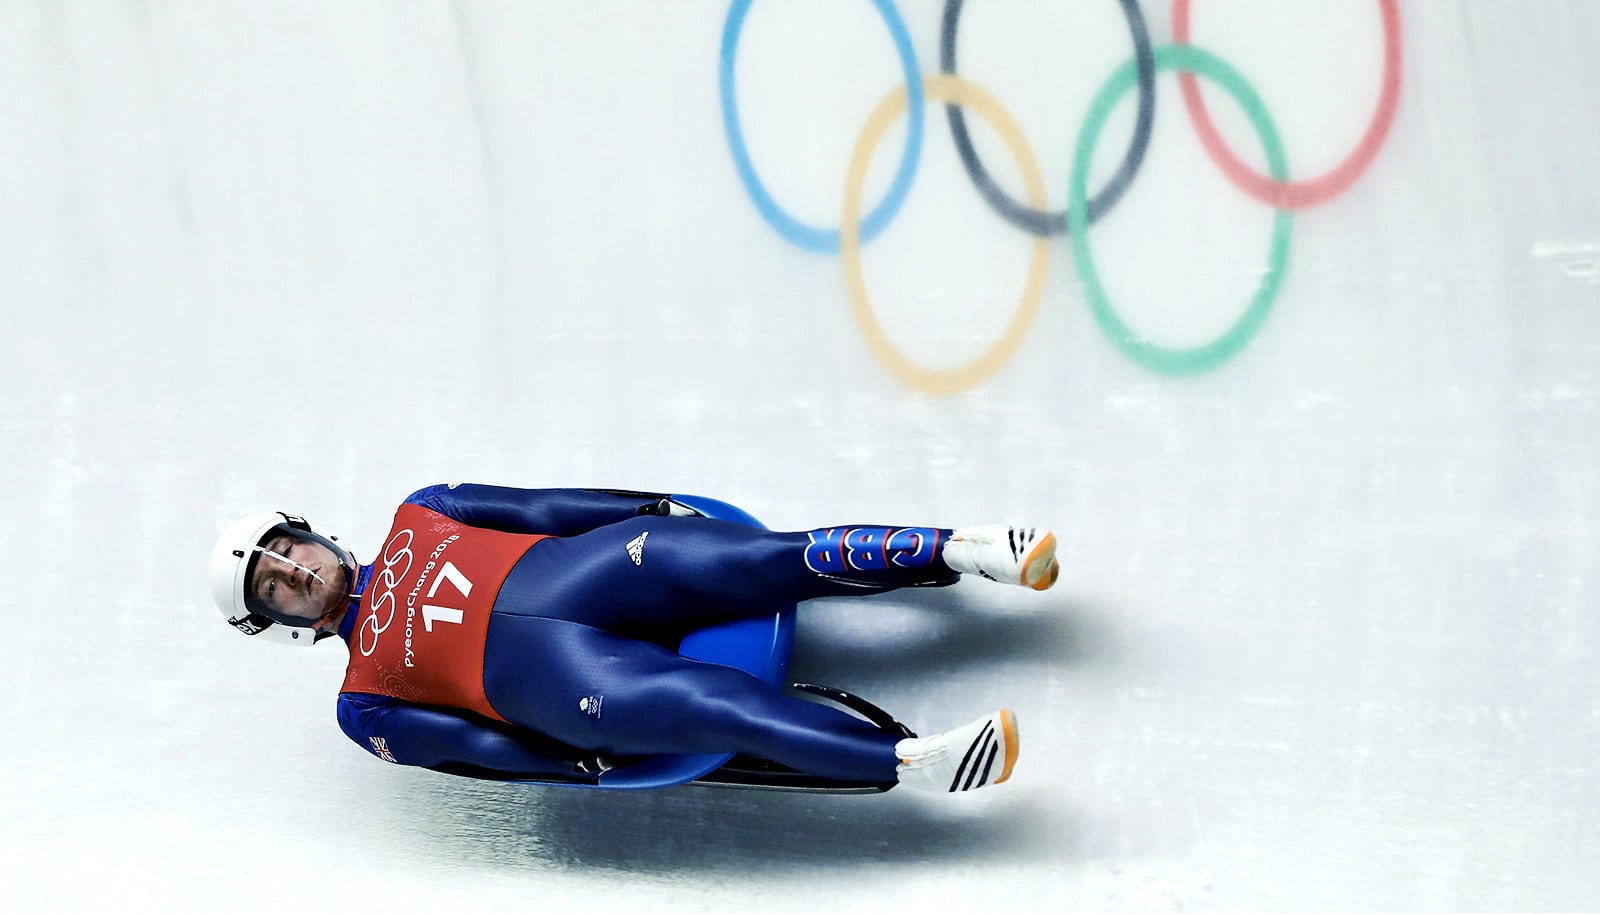
Behind the scenes of every skating routine, ski jump, and slalom race at the 2026 Winter Olympics, sophisticated analytics are at work, turning super athletes into record-breakers—and helping fans understand what makes these games extraordinary.
Hassan Rafique, assistant professor of sport analytics in the David B. Falk College of Sport at Syracuse University, studies how data transforms both athletic performance and sports storytelling.
Here, he shares how analytics are changing the Olympic experience for fans and athletes:
What kind of analytics might broadcasters and sports journalists use to make their storytelling more compelling?
With recent technological advancements, we can access player-tracking data in real time, opening up a range of possibilities for storytelling in fast-paced Olympic sports. Broadcasters and sports journalists can partner with analytics and technology platforms to turn raw athletic performance data into narratives that are both engaging and informative—helping viewers understand not just who won, but how and why those results happened.
For example, augmented reality can display performance statistics, world-record comparisons, and on-screen contextual explanations, adding an extra layer of information and engagement for viewers.
In some instances, a “ghost player” can be introduced into the visuals to compare an average player with the leading competitor in the event or the world record holder. NBC used similar tools during the 2024 Summer Olympics.
In judged sports such as figure skating and freestyle skiing, journalists may use scoring breakdowns and element-level analytics to explain why athletes received certain scores.
How do coaches and athletes use analytics to improve performance?
Analytics play a vital role in training and competition for athletes and coaches, enhancing decision-making with objective insights.
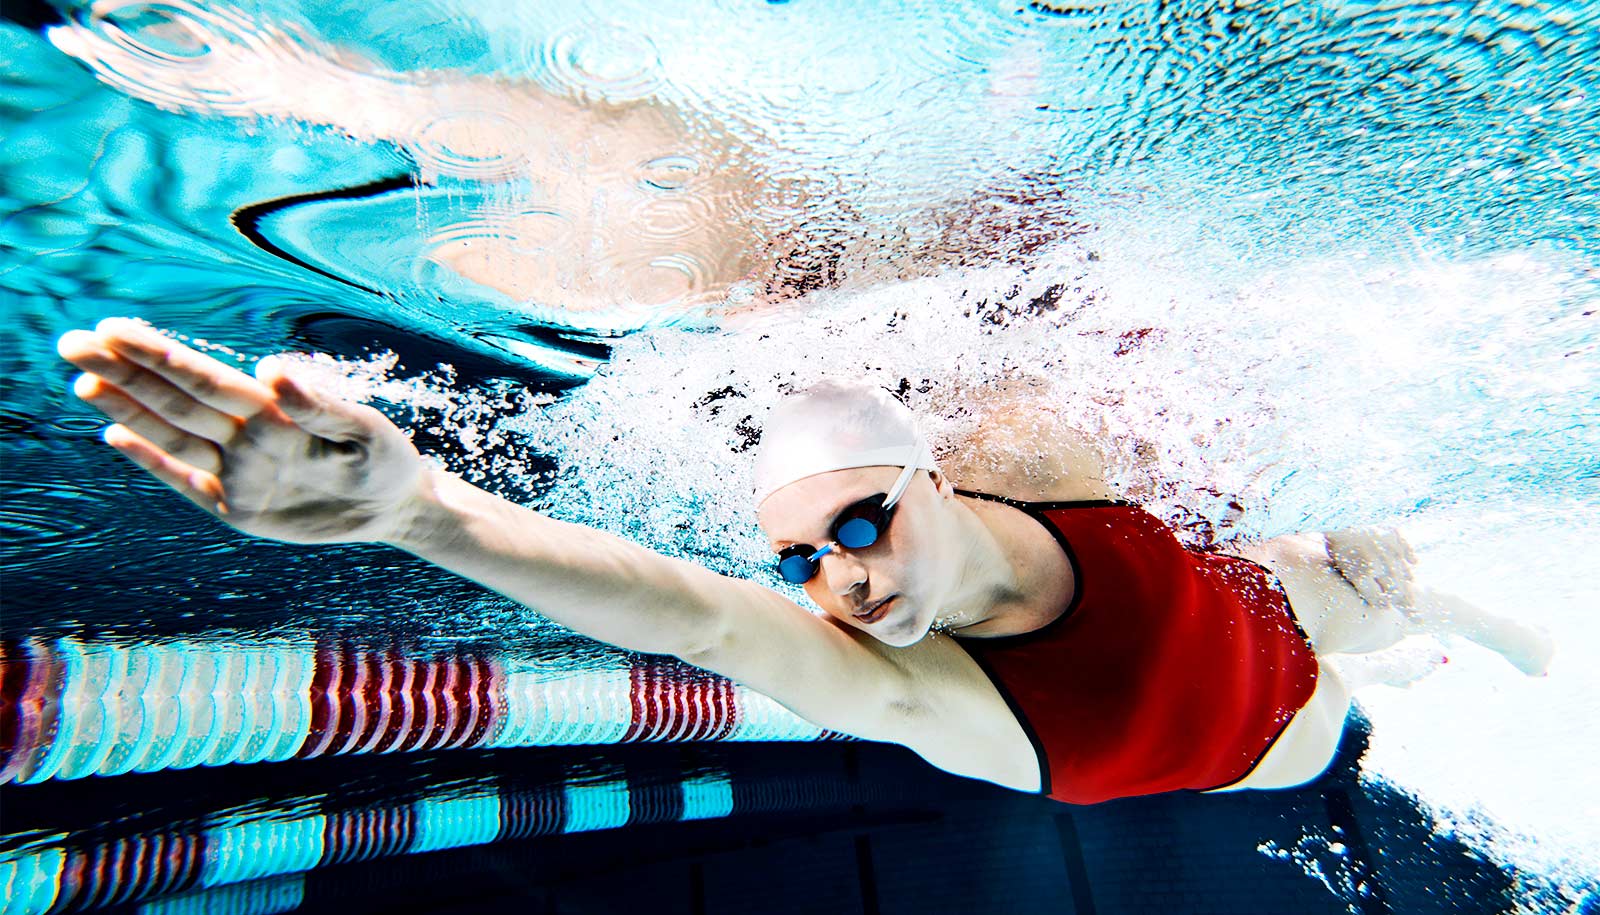
In such endurance and time-based sports as cross-country skiing, rowing, swimming, triathlon, speed skating, and cycling, athletes and coaches rely heavily on workload metrics, power output, pacing data, and heart-rate variability. These measures help balance training stress and recovery, refine race strategies, and ensure athletes peak at the right moment. For example, pacing analytics in speed skating or cycling can reveal whether an athlete is expending energy too aggressively early in a race or leaving performance on the table late.
In technical and judged sports, figure skaters, gymnasts, swimmers, and divers use high-speed video and motion analysis to study such variables as jump height, rotation speed, stroke rate, takeoff angle, and landing mechanics. Ski jumpers analyze in-run speed, takeoff timing, and flight aerodynamics using a combination of high-speed cameras and sensor data.
Wearable sensors play a key role across many Olympic sports. In endurance disciplines like cross-country skiing and rowing, wearables track training load, power, and physiological stress to support individualized training plans and reduce injury risk.
What are the tools that sport analytics use to delve deep into the Olympics?
At the foundation are measurement and sensing tools, such as high-speed, high-resolution video systems, wearable sensors (including GPS and inertial measurement units), force plates, and timing systems accurate to thousandths of a second. These technologies generate detailed data on movement, speed, force, and physiological load across nearly all Olympic sports. Analysts then work with programming languages, along with video analysis platforms, to clean data, assess model performance, and extract insights.
Artificial intelligence has significantly accelerated Olympic analytics, particularly through computer vision and machine learning. AI vision models can now automatically detect athlete poses, track movement trajectories, and classify techniques directly from video feeds, reducing the need for manual tagging or wearable devices.
In sport-specific contexts, analysts use specialized third-party platforms that provide domain expertise, such as wind and strategy analytics in sailing, possession and expected-goals models in ice hockey, or spatial-tactical analysis tools.
Together, these tools show how AI is not replacing sport analysts but amplifying their work—making analytics faster, more scalable, and more deeply integrated into performance optimization, coaching decisions, and Olympic storytelling.
What do you want students to pay attention to during the Olympics?
I would encourage students to look beyond medals and final results and instead ask analytical questions about performance.
- How consistent is an athlete across qualification rounds and finals?
- How do pacing strategies differ between medalists and non-medalists?
- How do contextual factors such as altitude, ice quality, snow conditions, or wind influence outcomes?
I also want students to think carefully about contextualized analytics. Olympic data are unique: sample sizes are often small, competitive pressure is extreme, and conditions can vary widely. A model or metric that works well in a professional league does not always translate directly to the Olympic setting.
Finally, I ask students to pay attention to how analytics are communicated. Strong Olympic analytics enhance storytelling by adding comparison and context—such as how a current performance stacks up against historical trends or how environmental conditions shape results. Analytics should illuminate sport, not obscure it.
What are you most interested in seeing at these Games?
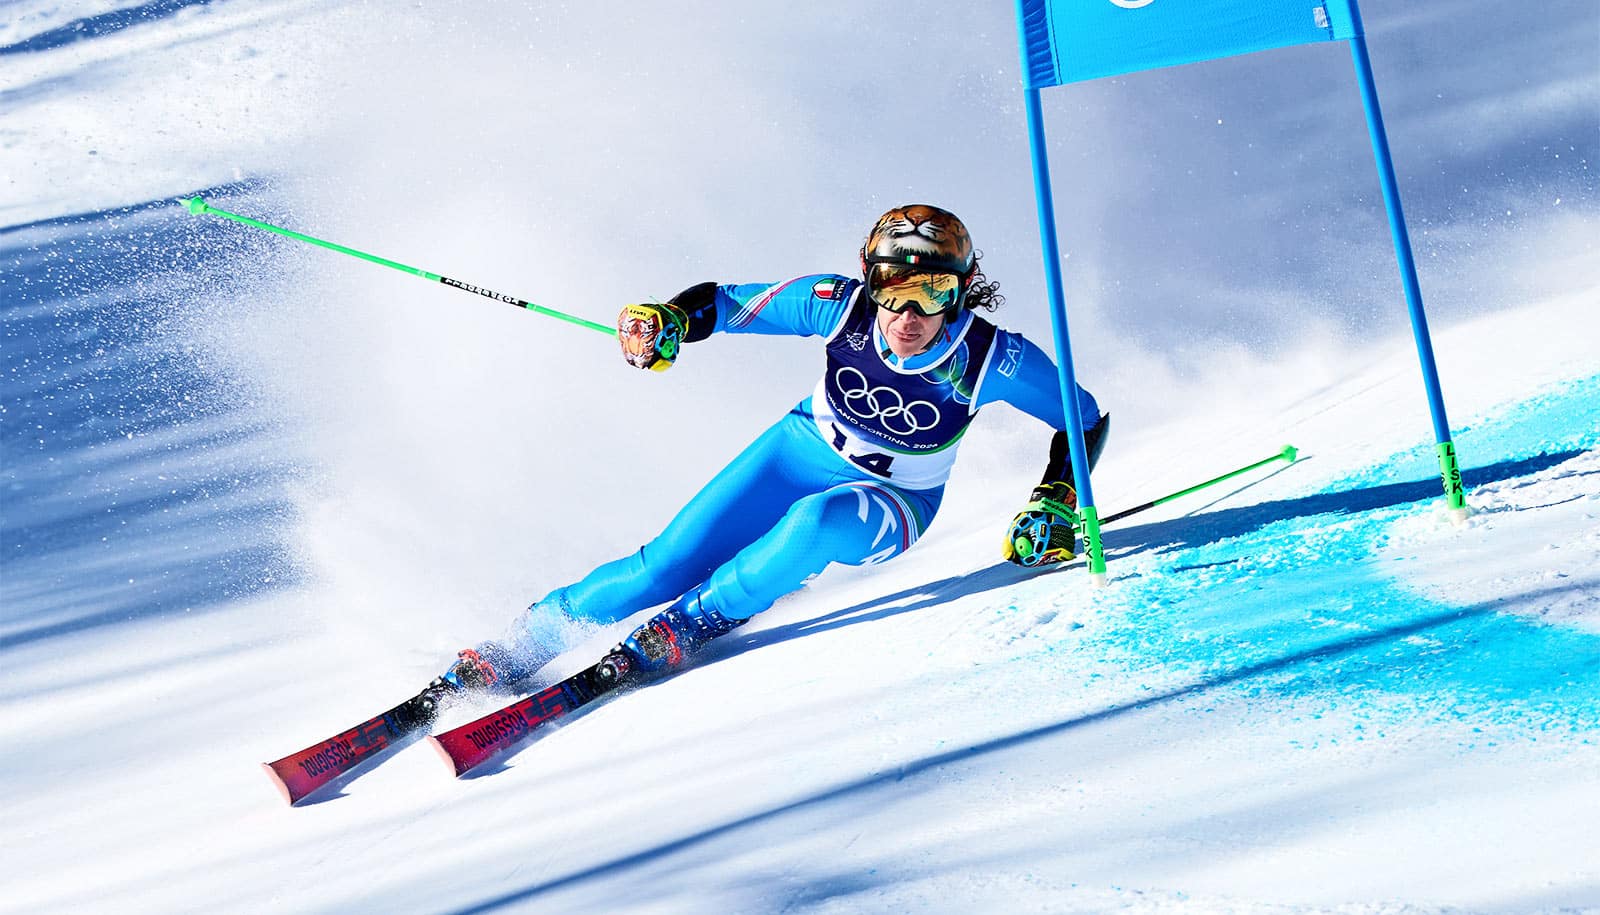
Moving to Syracuse, with its heavy snowfall, has reignited my interest in skiing competitions. I am looking forward to exploring the new technological and analytical advancements in the broadcasting and storytelling of these events.
Last year, at a sports analytics conference, I learned about curling and the research being done in that sport. I am also eager to see how curling is covered in the media.
Source: Syracuse University