A new way to show exactly how much the city of Houston has changed in the last two decades gives a dramatic visual record of the city’s growth in the 21st century.
Instead of the conventional practice of collecting data on housing starts and real estate parcels to track urban growth, this new research takes advantage of supercomputing, artificial intelligence, and, most importantly, a constellation of satellites that have been capturing images of the Greater Houston area from 438 miles above Earth for decades.
“Seeing these maps in motion really helps to visualize what lies behind the numbers on Houston’s dramatic population growth,” says Chris Hakkenberg, a scholar at the Kinder Institute for Urban Research at Rice University.
“Looking across the space, we see whole ecosystems of highways and commercial real estate, retail, and residential neighborhoods emerge upon the landscape in rapid succession.”
The technique documents changes in Houston’s land cover with a series of GIFs dating back to the late 20th century. The visualization shows not just where the city is growing and when, but how fast and at what densities of urban cover. The data product is unique for its simultaneous fine resolution and vast extent in space and time. All data products are freely available on the Kinder Institute’s Urban Data Platform (UDP).
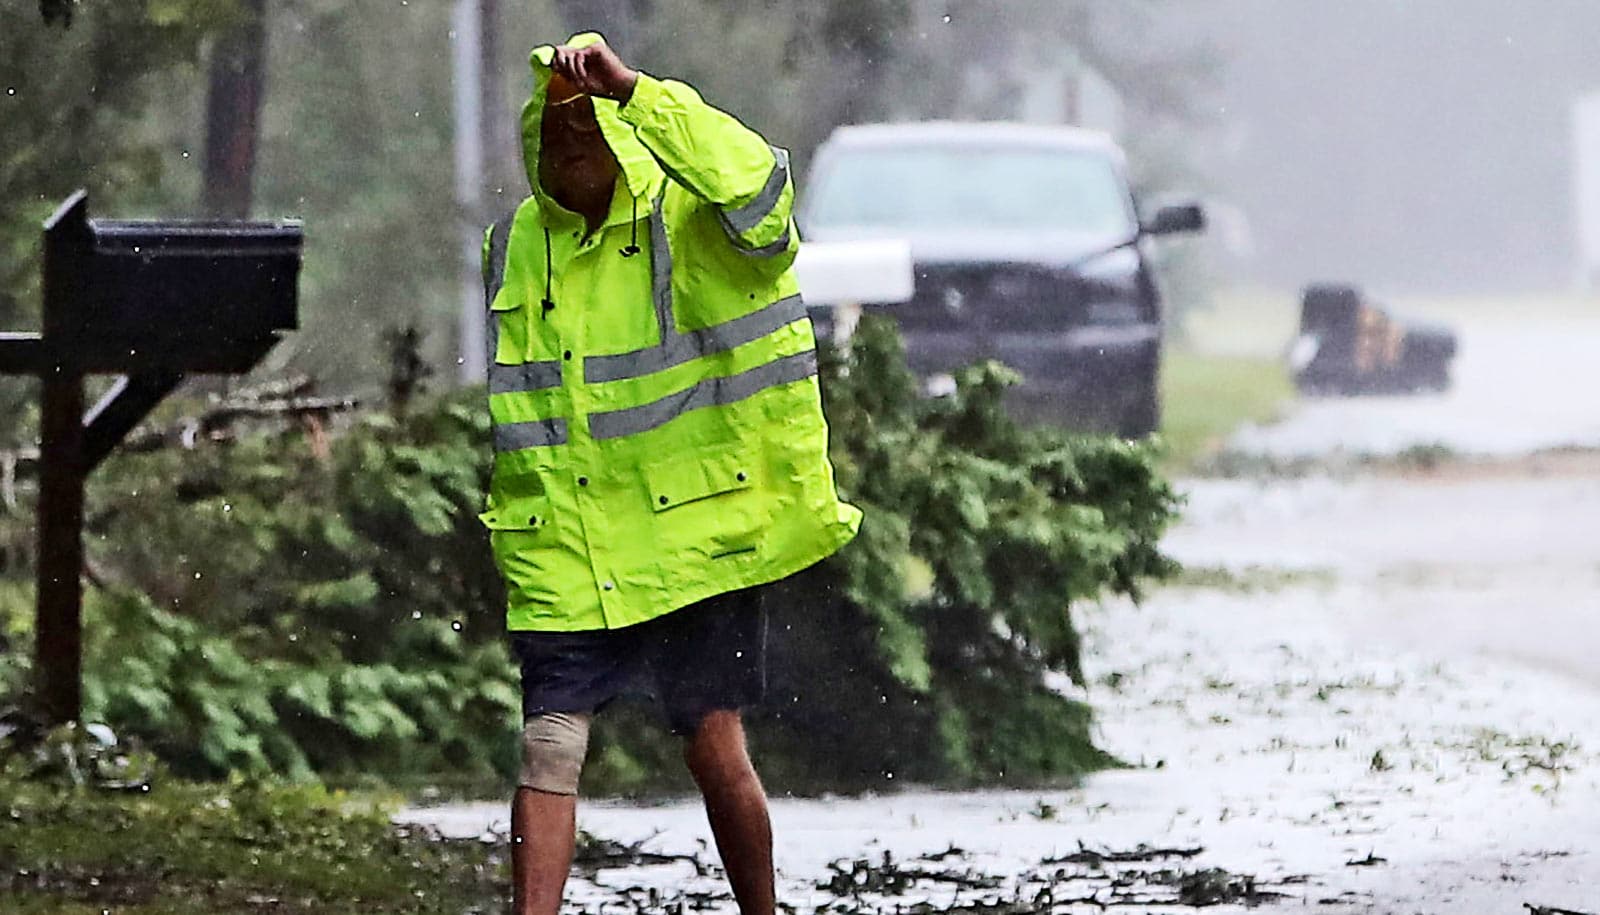
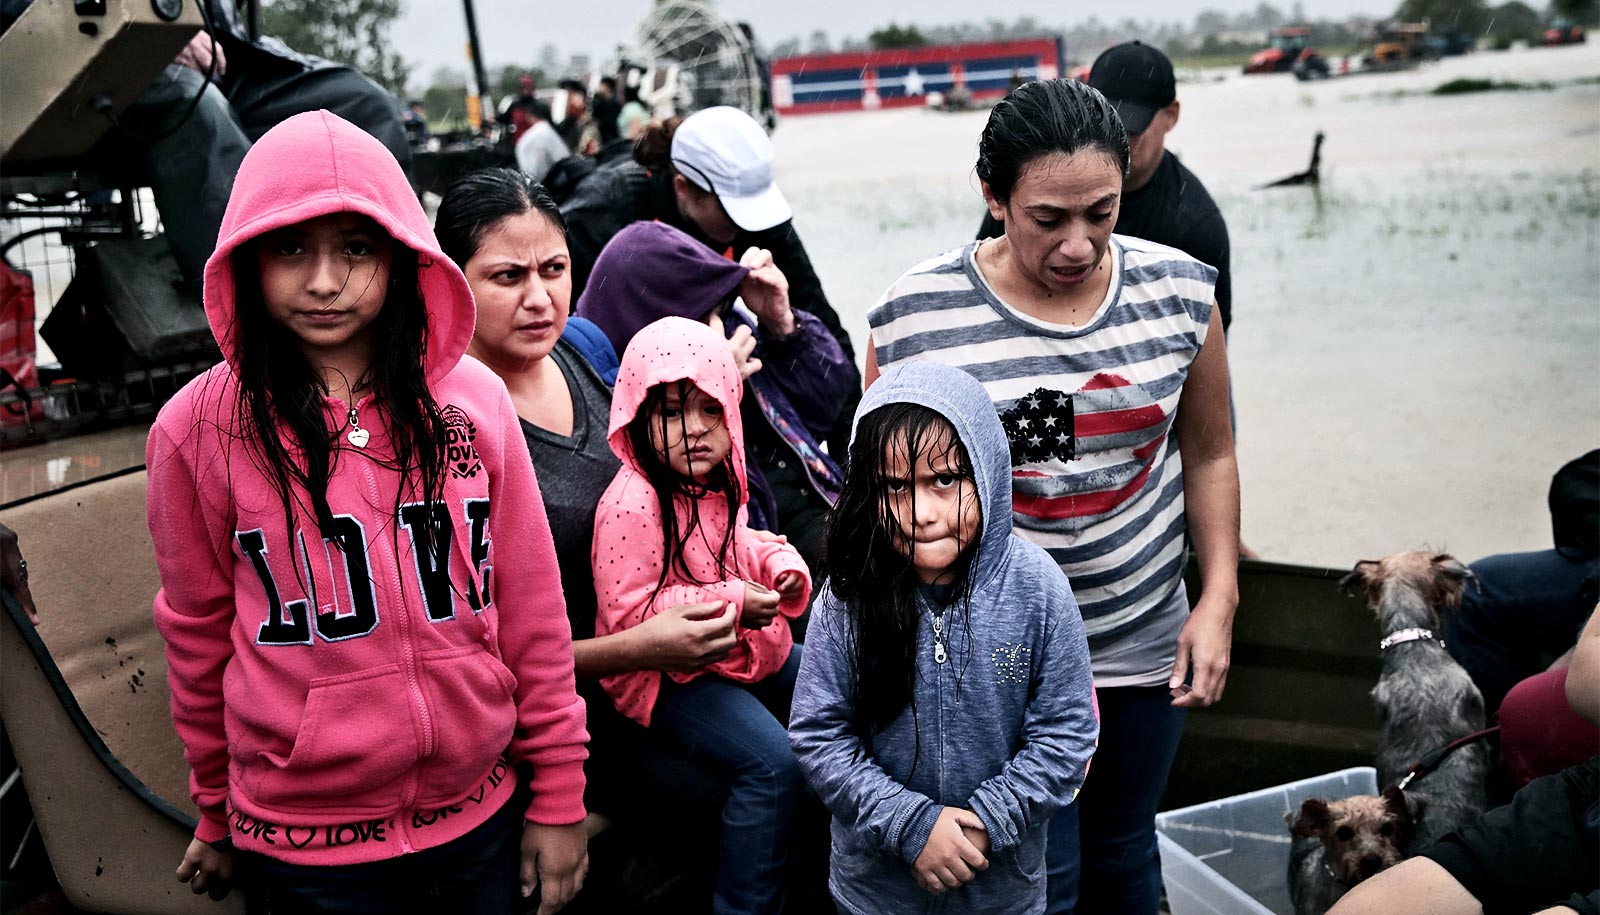
Hakkenberg was especially interested in documenting how the conversion of 800 square miles of farms, wetlands, and forests to impervious surfaces in the last 21 years can exacerbate the effects of the colossal rainfall events the city has experienced in recent years. In all, 20% of these newly converted lands fell within the Federal Emergency Management Agency’s 100-year flood plain; 14% were within federally recognized wetland habitat.
“Houston’s dramatic growth is a point of pride for this diverse and dynamic city,” Hakkenberg says. “However, if the past is prologue to the future, then the city should be especially concerned that unbridled development, especially in flood plains and wetlands, could exacerbate potentially catastrophic flooding risks in an increasingly unstable climate future.”
Hakkenberg says rapid and vast urbanization coupled with more frequent and intense hurricanes could have devastating consequences, especially for the city’s most vulnerable residents.
“Planning for these contingencies will, at the regional scale, require a concerted effort to make sure that prevention and post-disaster recovery are included in future development plans,” he says.
The tool is designed so that urban planners and public policymakers can make informed choices to prepare for and recover from disasters, Hakkenberg says.
“I hope these advances in remote sensing and machine learning image interpretation will provide planners and policymakers access to the state-of-the-art data and tools they’ll need to make informed and life-saving choices.”
A paper in International Journal of Remote Sensing describes the methodology.
Funding for the research came from the Houston Endowment, the Kinder Institute, and the Rice Academy of Fellows. The full GIS map time series is freely accessible on the Kinder Institute’s UDP.
Source: Rice University